Dashboard
Dashboard
Section titled “Dashboard”The SSH-KLM Dashboard provides a real-time security posture overview of your SSH key infrastructure.
It consolidates discovery results, risk analytics, host coverage, and trend data into a unified operational view.
Key Metrics
Section titled “Key Metrics”The top summary cards provide immediate operational insight.
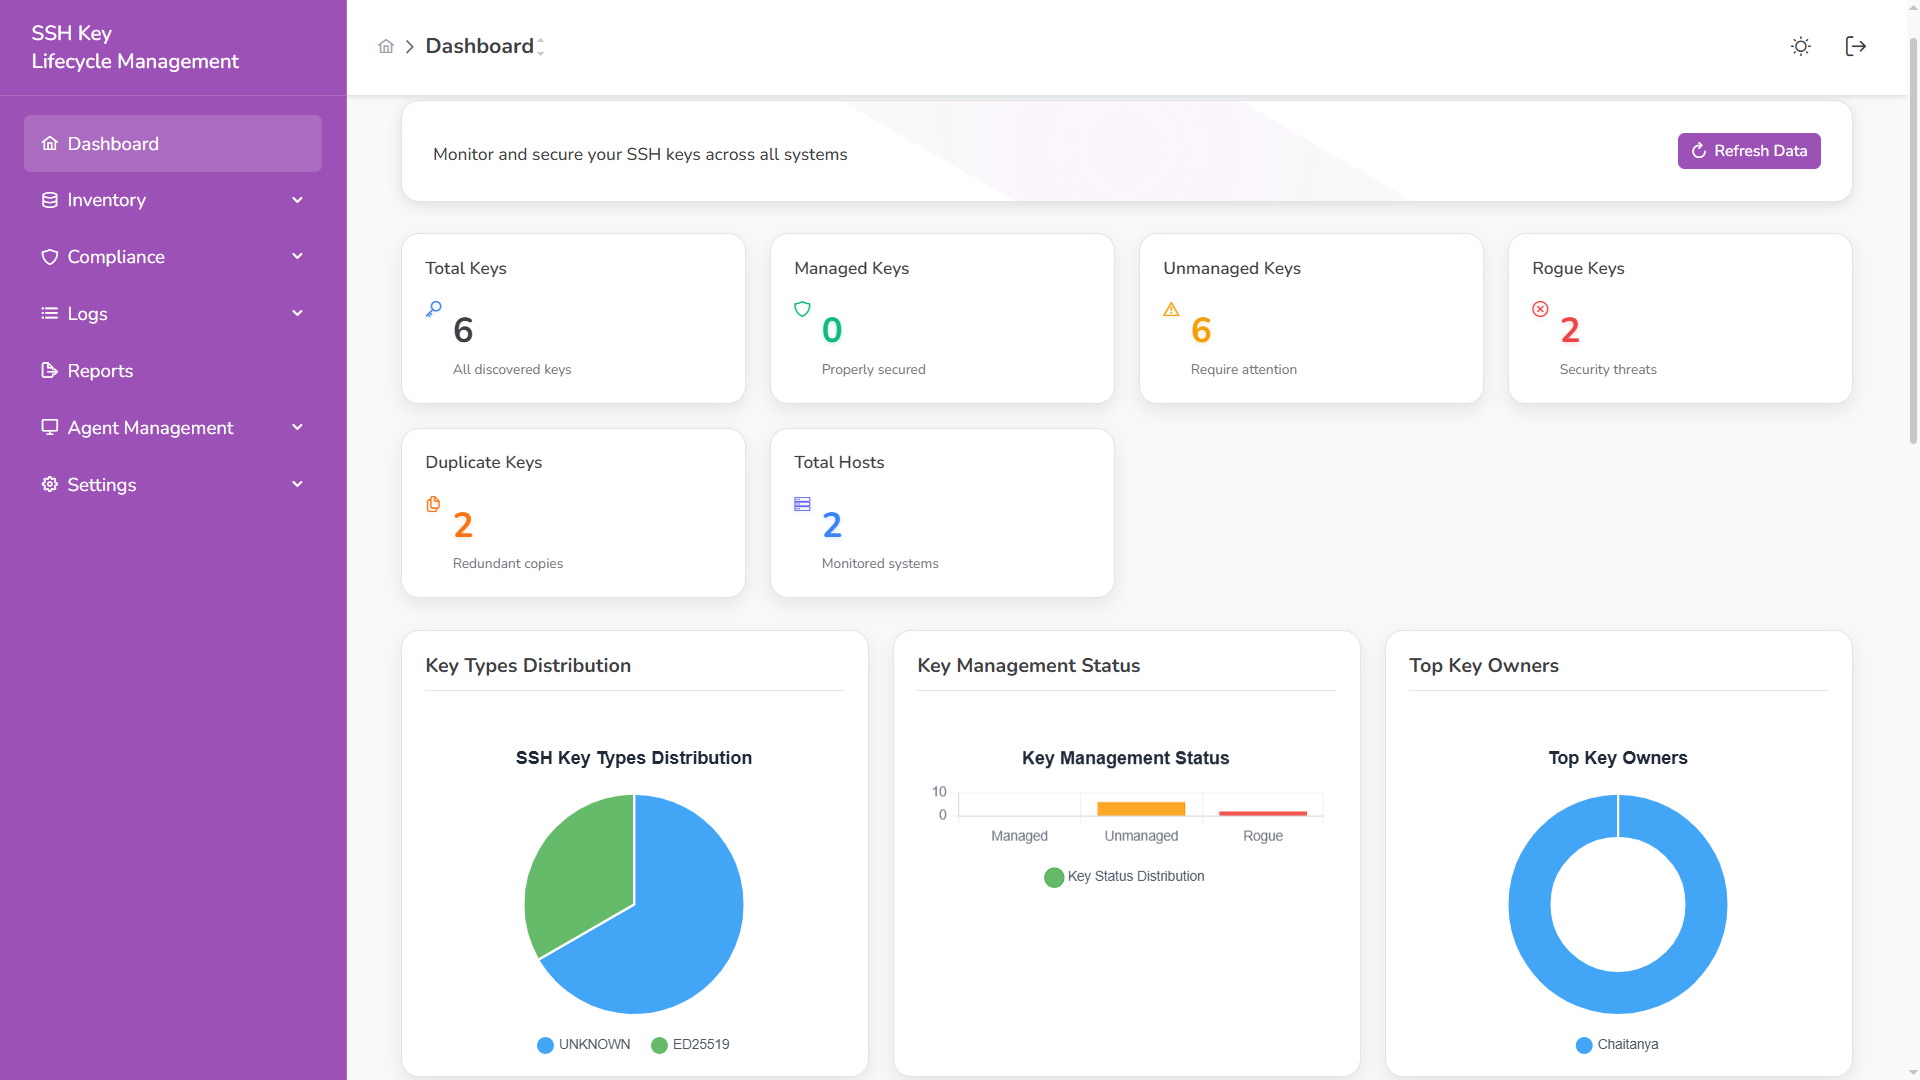
Summary Cards
Section titled “Summary Cards”| Metric | Description |
|---|---|
| Total Keys | All SSH keys discovered across monitored systems |
| Managed Keys | Keys approved and compliant with policy |
| Unmanaged Keys | Keys discovered but not yet governed |
| Rogue Keys | Unauthorized or high-risk keys |
| Duplicate Keys | Keys reused across multiple hosts |
| Total Hosts | Systems reporting via active agents |
Each metric includes contextual classification:
- 🟢 Managed – Secure and governed
- 🟡 Unmanaged – Requires review
- 🔴 Rogue – Immediate investigation required
- 🟠 Duplicate – Shared credential risk
Inventory Insights
Section titled “Inventory Insights”Key Types Distribution
Section titled “Key Types Distribution”Displays algorithm distribution across the environment.
- ED25519 (recommended modern standard)
- RSA
- ECDSA
- Unknown / legacy types
Helps identify cryptographic modernization gaps.
Key Management Status
Section titled “Key Management Status”Bar visualization comparing:
- Managed keys
- Unmanaged keys
- Rogue keys
Enables quick risk posture assessment.
Top Key Owners
Section titled “Top Key Owners”Identifies users or service accounts with the highest number of associated SSH keys.
Useful for:
- Privilege concentration analysis
- Insider risk visibility
- Access review prioritization
Discovery & Risk Analytics
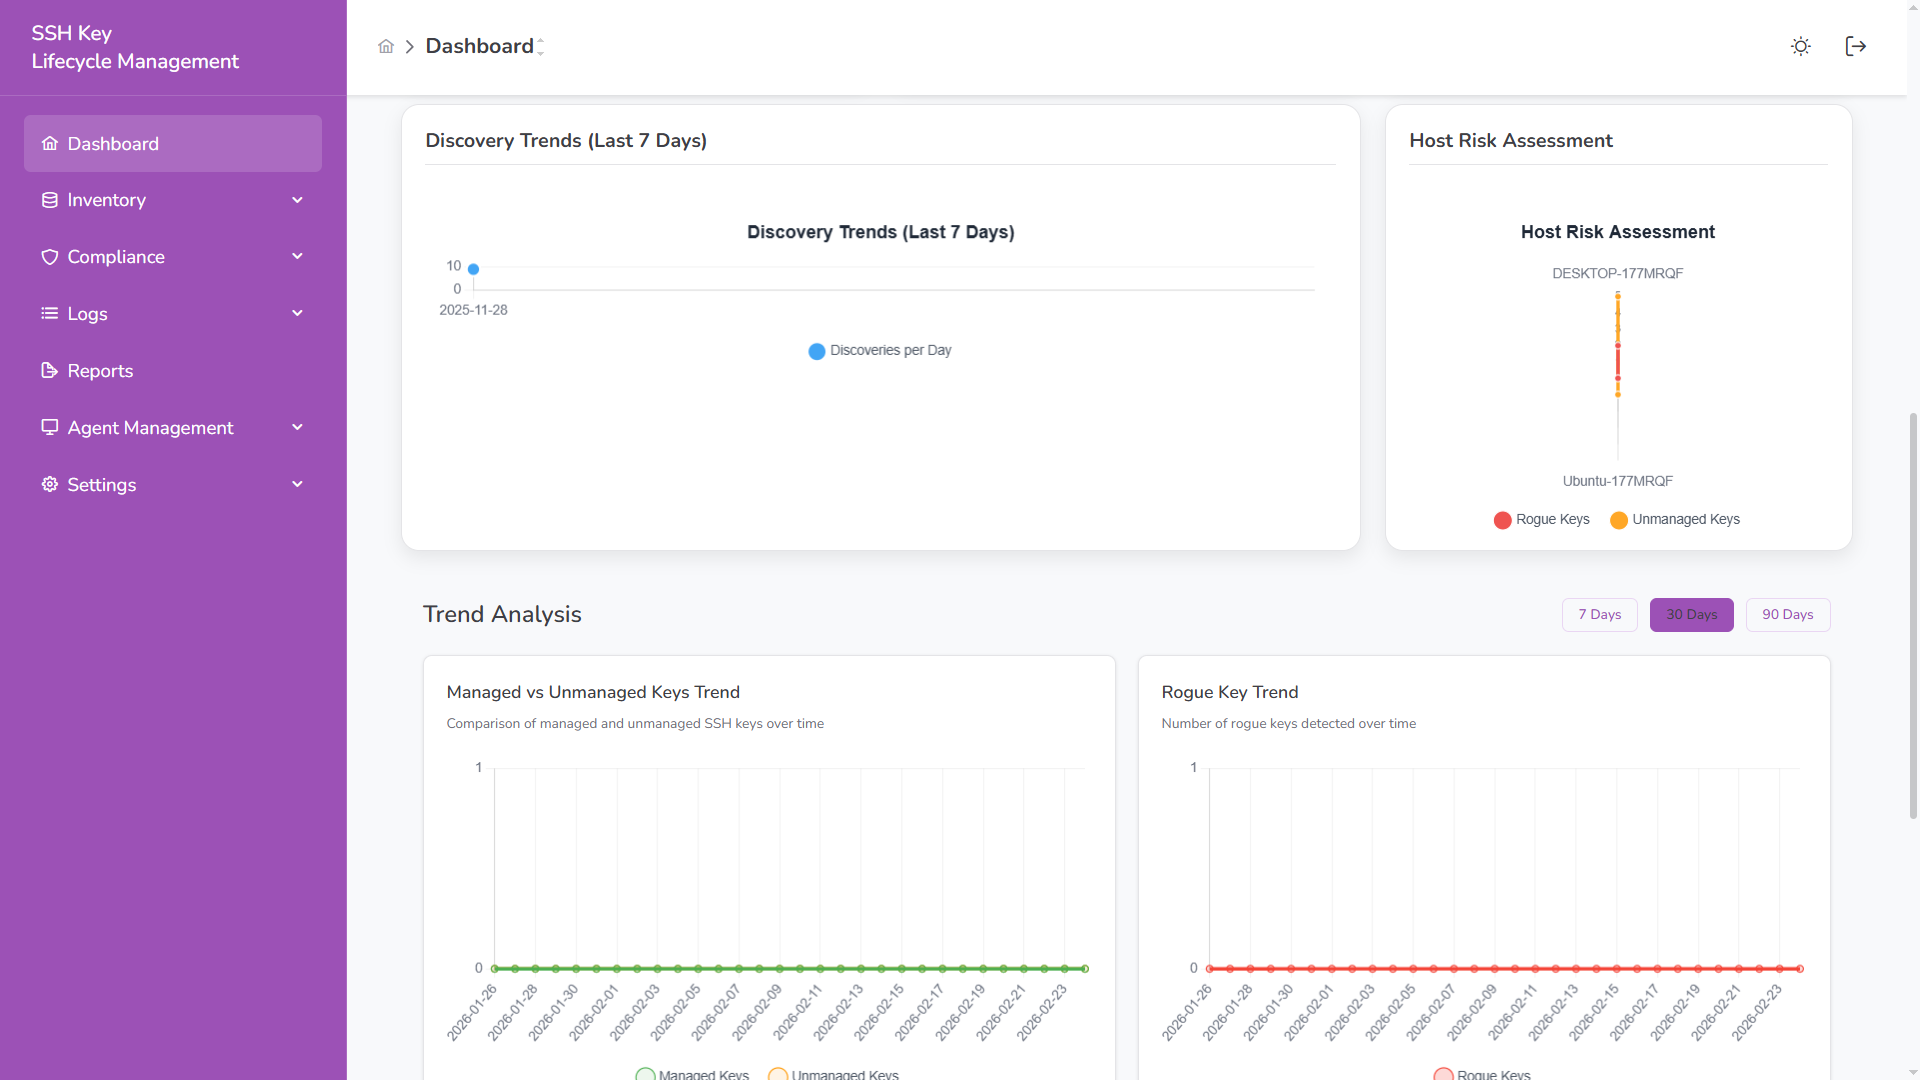
Section titled “Discovery & Risk Analytics”Discovery Trends (Last 7 Days)
Section titled “Discovery Trends (Last 7 Days)”Shows new SSH keys discovered per day.
Used to:
- Detect unusual spikes
- Monitor onboarding activity
- Track infrastructure growth
Host Risk Assessment
Section titled “Host Risk Assessment”Per-host visualization showing:
- Rogue key presence
- Unmanaged key count
Helps prioritize remediation at the host level.
Trend Analysis
Section titled “Trend Analysis”Dashboard supports time filters:
- 7 Days
- 30 Days
- 90 Days
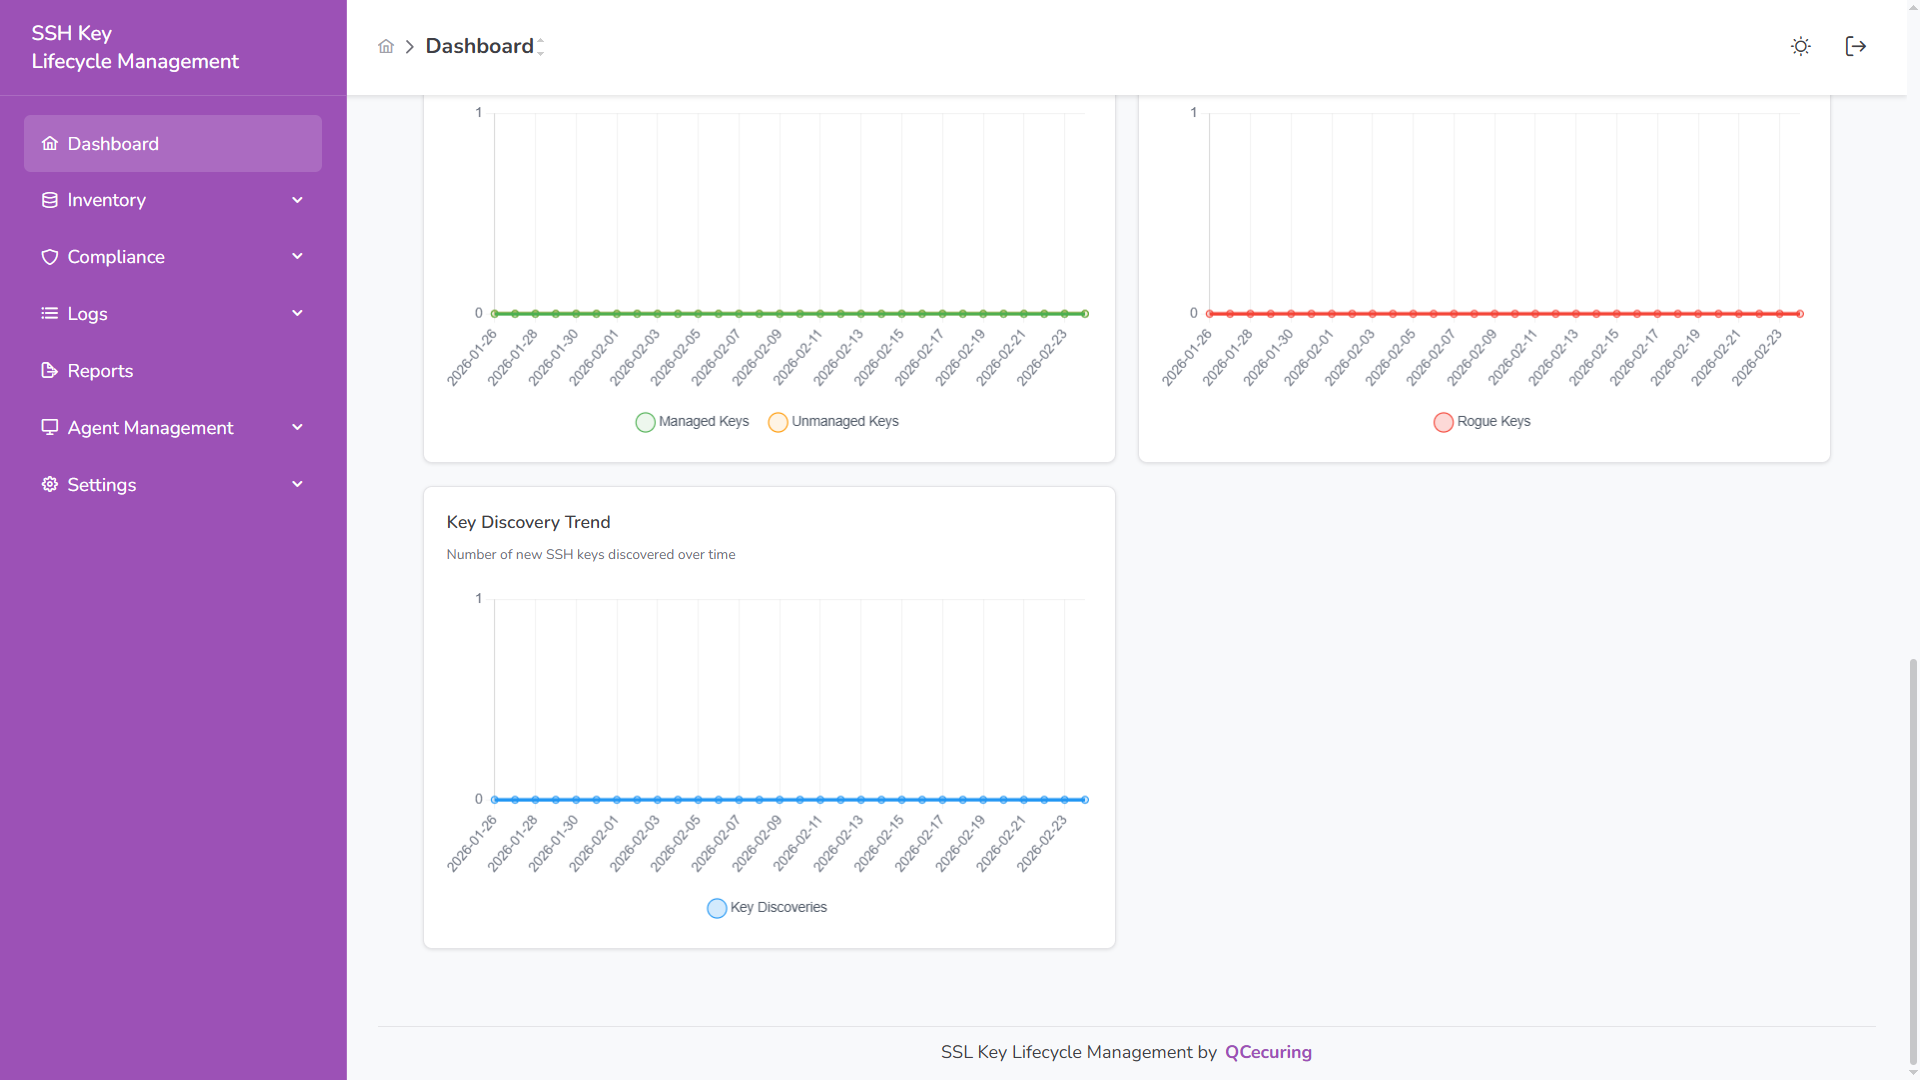
Managed vs Unmanaged Trend
Section titled “Managed vs Unmanaged Trend”Tracks governance progress over time.
Rogue Key Trend
Section titled “Rogue Key Trend”Monitors detection frequency of unauthorized keys.
Key Discovery Trend
Section titled “Key Discovery Trend”Shows growth rate of SSH key creation.
Dark Mode
Section titled “Dark Mode”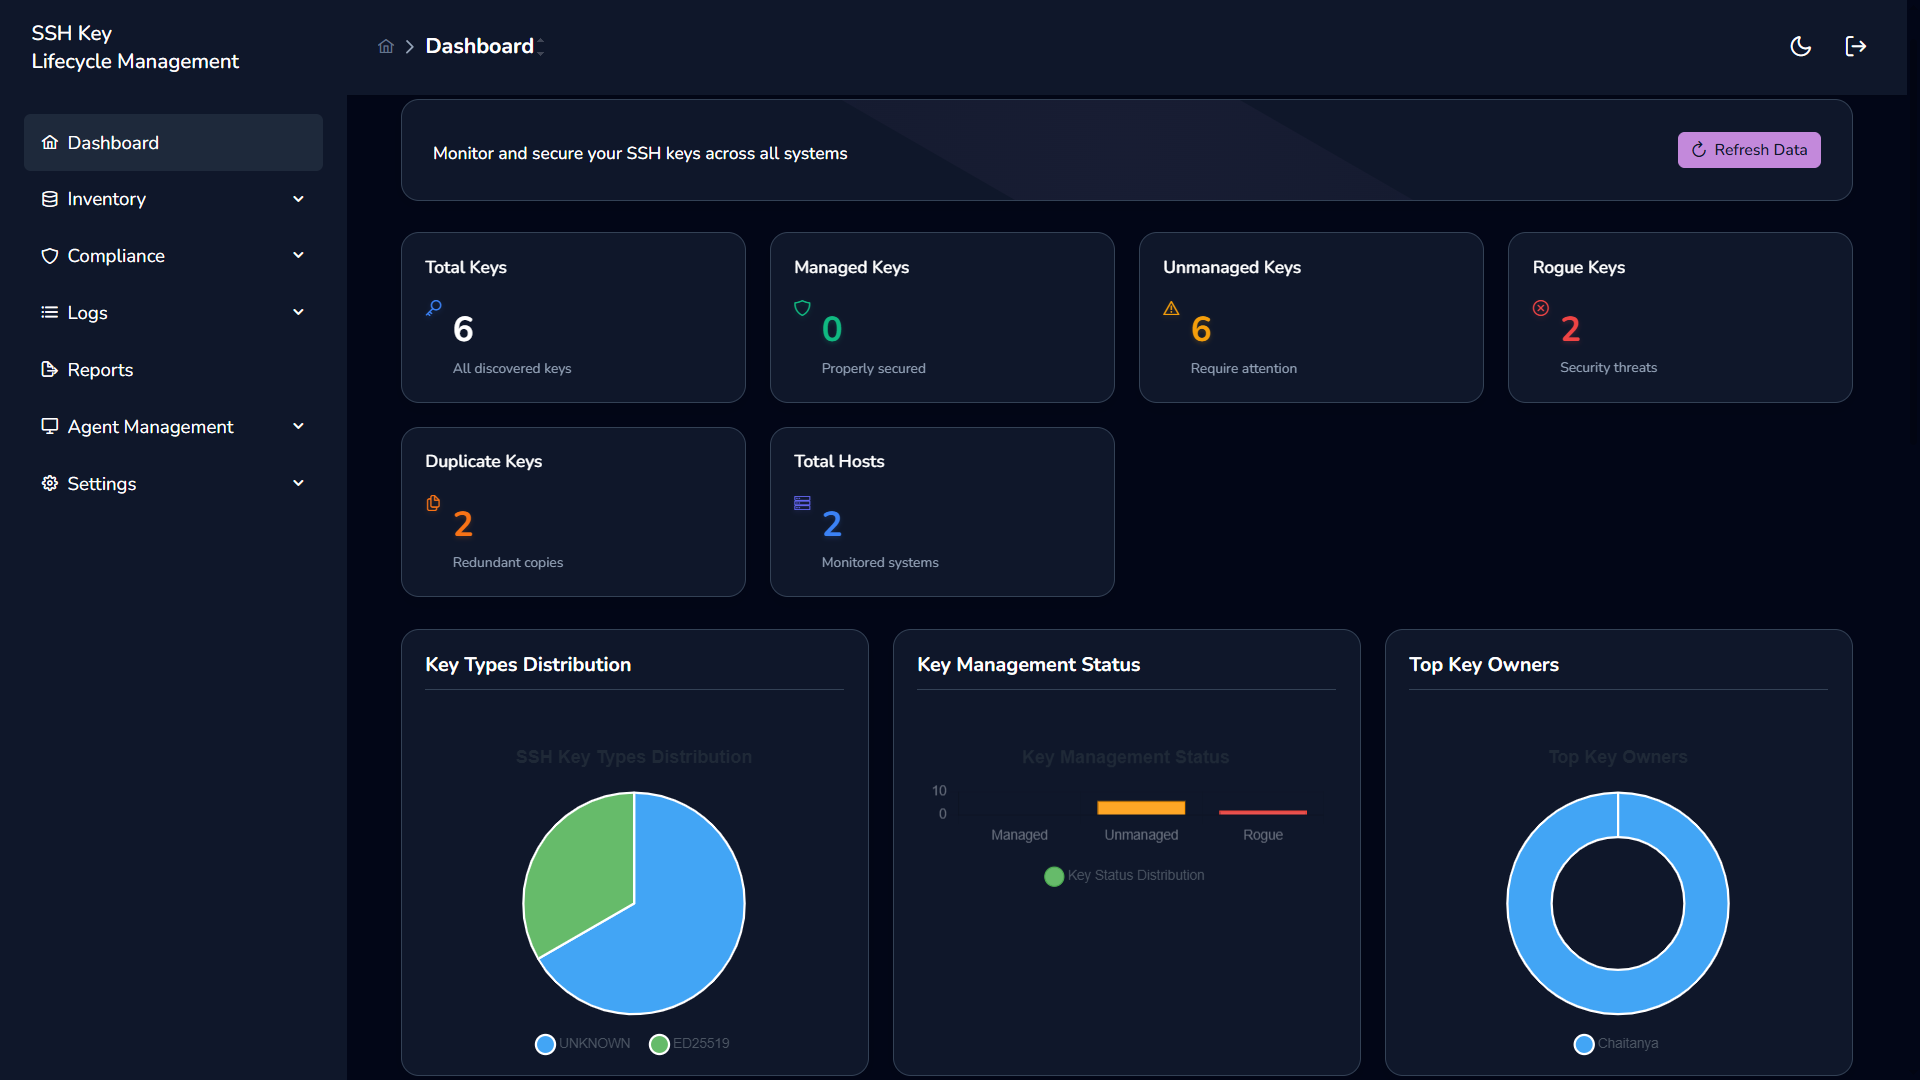
The dashboard supports both light and dark themes with identical functionality.
Agent Coverage
Section titled “Agent Coverage”The dashboard reflects:
- Total monitored hosts
- Active agent count
- Discovery freshness
Agent health directly impacts metric accuracy.