Dashboard
Dashboard
Section titled “Dashboard”The Dashboard is the operational command center for SSL Certificate Lifecycle Management. It provides real-time visibility into certificate posture, infrastructure health, and operational performance.
Navigation: Sidebar → Dashboard
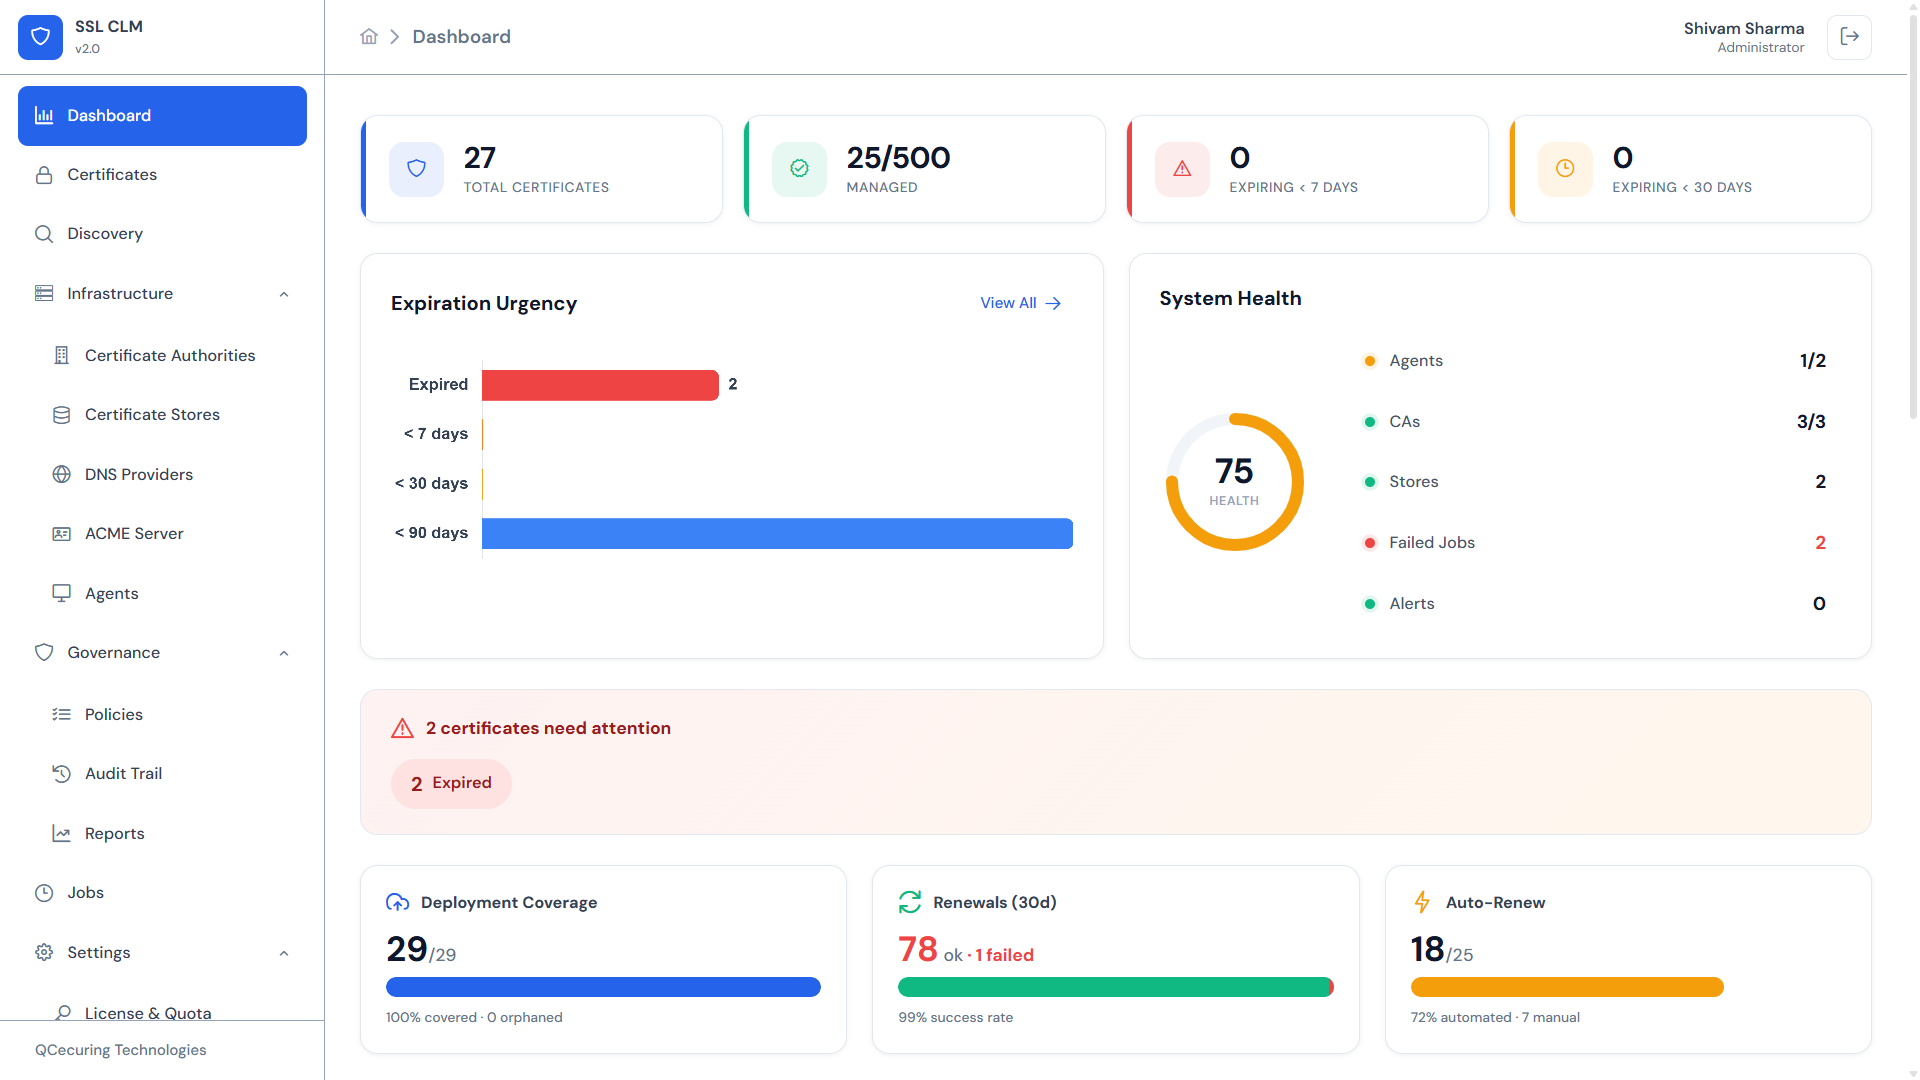
Summary Cards
Section titled “Summary Cards”The top row displays four key metrics:
| Card | Description |
|---|---|
| Total Certificates | Total number of certificates tracked in inventory (managed + monitored) |
| Managed | Certificates under active lifecycle management, shown against your license quota (e.g., 25 / 500) |
| Expiring < 7 Days | Certificates that will expire within the next 7 days — requires immediate action |
| Expiring < 30 Days | Certificates expiring within the next 30 days — plan renewal |
Each card is clickable and navigates to the Certificates page with the corresponding filter applied.
Attention Banner
Section titled “Attention Banner”When certificates require immediate action, a prominent banner appears below the summary cards:
“2 certificates need attention — 2 Expired”
The banner is color-coded by severity:
- Red — Expired or critical (< 7 days)
- Orange — Warning (< 30 days)
Click the banner to navigate directly to the affected certificates.
Expiration Urgency
Section titled “Expiration Urgency”A horizontal stacked bar chart groups certificates by urgency level:
| Urgency Level | Color | Meaning |
|---|---|---|
| Expired | Red | Past validity — service risk |
| < 7 days | Dark orange | Critical — immediate renewal needed |
| < 30 days | Orange | High — schedule renewal |
| < 90 days | Yellow | Medium — plan ahead |
A “View All” link navigates to the full certificate list filtered by expiration status.
System Health
Section titled “System Health”A radial gauge displays an overall Health Score (0–100) calculated from infrastructure component health.
Component Status Indicators
Section titled “Component Status Indicators”Below the gauge, individual health indicators show:
| Component | What It Measures |
|---|---|
| Agents | Online agents / total agents |
| CAs | Healthy CAs / total configured CAs |
| Stores | Connected stores / total configured stores |
| Failed Jobs | Count of jobs in FAILED status |
| Alerts | Unacknowledged alert count |
Color Coding
Section titled “Color Coding”- Green — All healthy, no issues
- Orange — Degraded, some components need attention
- Red — Critical, immediate investigation required
The health score drops when agents go offline, CAs become unreachable, stores disconnect, or jobs fail repeatedly.
Operational Metrics
Section titled “Operational Metrics”The bottom row displays three operational KPI panels:
Deployment Coverage
Section titled “Deployment Coverage”Shows how well your managed certificates are deployed:
- Deployed — Count of certificates with at least one active deployment
- Total — Total managed certificates
- Orphans — Certificates with no deployment target (issued but not installed anywhere)
A high orphan count may indicate certificates that were issued but never deployed, or deployments that were removed.
Renewals (30d)
Section titled “Renewals (30d)”Renewal performance over the past 30 days:
- Success Rate — Percentage of renewals that completed successfully
- Total Renewed — Number of successful renewals
- Failures — Count of renewal attempts that failed
Click through to the Jobs page filtered to renewal jobs for failure investigation.
Auto-Renew
Section titled “Auto-Renew”Automation adoption metric:
- Enabled — Certificates with auto-renewal configured
- Manual — Certificates requiring manual renewal intervention
A low auto-renew ratio means more manual work and higher risk of missed renewals.
Dark Mode Support
Section titled “Dark Mode Support”The dashboard fully supports dark mode. Toggle between light and dark themes via Settings → Theme.
Operational Best Practices
Section titled “Operational Best Practices”- Check the Attention Banner for any expired or critical certificates
- Review the System Health gauge — investigate any orange/red indicators
- Monitor Failed Jobs count
Weekly
Section titled “Weekly”- Review the Expiration Urgency chart for upcoming renewals
- Check Deployment Coverage for orphan certificates
- Investigate any certificates still on manual renewal
Monthly
Section titled “Monthly”- Review Auto-Renew adoption and convert manual certificates where possible
- Analyze renewal success rate trends
- Generate compliance reports from Governance → Reports
Related Pages
Section titled “Related Pages”- Certificates — Full inventory management
- Jobs — Background job monitoring
- Agents — Agent health details
- Policies — Configure renewal thresholds